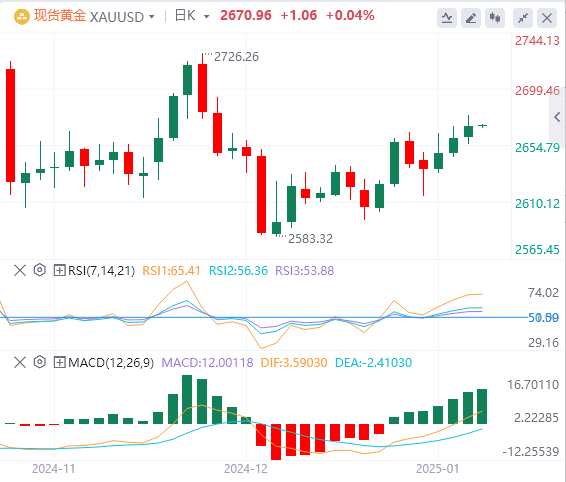
Spot gold maintained its upward trend, approaching the 2680 mark at one point. As of now, the gold price is 2670.97.

Speech by Federal Reserve officials:
Federal Reserve-Harker: On the road to rate cuts, but should pause and observe the situation.
Collins: The current outlook requires a gradual and patient approach to rate cuts. Schmid: Interest rates may be close to neutral levels; Bowman: A cautious attitude should be taken in response to interest rate adjustments, and supports the December rate cut as the "last step" of policy readjustment.
Bank of England Deputy Governor: Support rate cuts, but it is difficult to know how fast they will be cut.
Data from consulting firm Challenger Gray shows that US companies' 2024 recruitment announcements hit a nine-year low.
Trump's tariff concerns have caused the US market's silver and copper to be out of touch with the international market.
Trudeau: If Trump really imposes tariffs on Canada, we will definitely respond.
Sources revealed that the US and Ukrainian governments expect that negotiations between Ukraine and Russia may be held in the first half of 2025.
Lebanese Army Commander-in-Chief Joseph Aoun won the presidential election.
On Thursday, British bond yields soared above 5%, the highest level since 1998. In addition, the World Gold Council said that physically backed gold exchange-traded funds (ETFs) recorded net inflows for the first time in four years. Gold prices soared for the third consecutive day, rising 0.35% on Thursday, as investors sought safe havens amid U.S. tariffs and soaring British government bond yields.
Fed officials sent mixed signals on the path of rate hikes, and market trading was light. Several Fed officials said the Fed should be cautious in adjusting interest rates and may suspend rate hikes amid uncertainty. The current economic outlook suggests that the Fed will take a gradual approach to rate cuts. The market is now turning its attention to the December non-farm payrolls data and the University of Michigan Consumer Confidence Index to be released tonight to further obtain clues on the trend of the U.S. economy.
From a technical perspective, gold prices have been rising steadily. After breaking through and stabilizing at the 50-day SMA of $2,646, the trend is biased upward. If bullish sentiment remains excited and gold prices are maintained near $2,670, it may further challenge the resistance of the $2,700 mark, but a breakthrough is required to test the high of $2,726 on December 12. If the rally can continue to expand, the bulls will target the historical high of $2,790.
But if gold prices start to pull back, fall quickly and fall below the 50-day SMA, there is a possibility of testing the 100-day SMA support of $2,630. If it fails, the decline may extend to $2,600.
In addition, I think the short-term rise in gold is still a process of price trend transitioning to a higher consolidation pattern, and it is trading in a symmetrical triangle pattern that has fallen from its historical highs and rebounded from its lows. If you look closely at the chart, you will find that the trading range of gold is continuously narrowing and gradually approaching the apex of the pattern, which may indicate that gold is about to have a trend breakout and volatility is about to increase significantly.
The weekly chart shows that gold is likely to achieve a bullish breakout in this symmetrical triangle pattern, because it broke through last week's high of $2,665 this week, indicating that the high point of the band moved up, triggering a bullish reversal. If the closing price this week is higher than last week, the breakthrough will be confirmed.
We expect gold prices to show positive growth in 2025, but the increase will be relatively mild. We expect gold demand to remain well supported by existing major central bank and investor buyers as the drivers remain unchanged, namely economic uncertainty (global growth, inflation risks, Fed outlook), geopolitical tensions (deglobalization, conflict, protectionism) and continued high global sovereign debt.
We previously published our 2025 average gold price forecast of $2,823 in November. Since then, inflation and employment data have prompted more hawkish Fed rhetoric. Despite the more conservative outlook of no further rate cuts in 2025 and the risk of 10-year Treasury yields moving up to 5%, gold prices could still exceed $2,600 in 2025.
In addition, we note that market concerns about rising yields are largely based on the narrative of rising inflation risks, including the risk of US protectionism, changes in immigration policy, and continued high budget deficits, all of which are bullish for gold.
With US non-farm payrolls data on the horizon, gold's short-term technicals should draw battle lines before the close of this week. Spot gold rebounded from trendline support at the close of December and has now recovered more than 3.1% from its lows, now approaching resistance around 2671-2680. A breakout/close above the October trendline would be expected to see a larger rally to validate the feasibility of a breakout from months of consolidation. The upside breakout of the pattern puts the focus on the reversal close of 2715, which ultimately needs to close above that level to signal a resumption of the uptrend, moving towards the record daily close high of 2744 and the record high/2.618% extension of 2787-2804.
On the other hand, a closer look at the gold trend shows that gold has set a monthly opening range low of 2624 near the 2025 open. Key support is at the 38.2% retracement of the May rally/October low at 2594-2603, and a break/close below this area threatens a larger correction in gold. In this case, the November low daily close is 2565 and the 50% retracement is 2532-2534 (both of which could be areas of concern for selling exhaustion if reached).